
Articles Tagged with
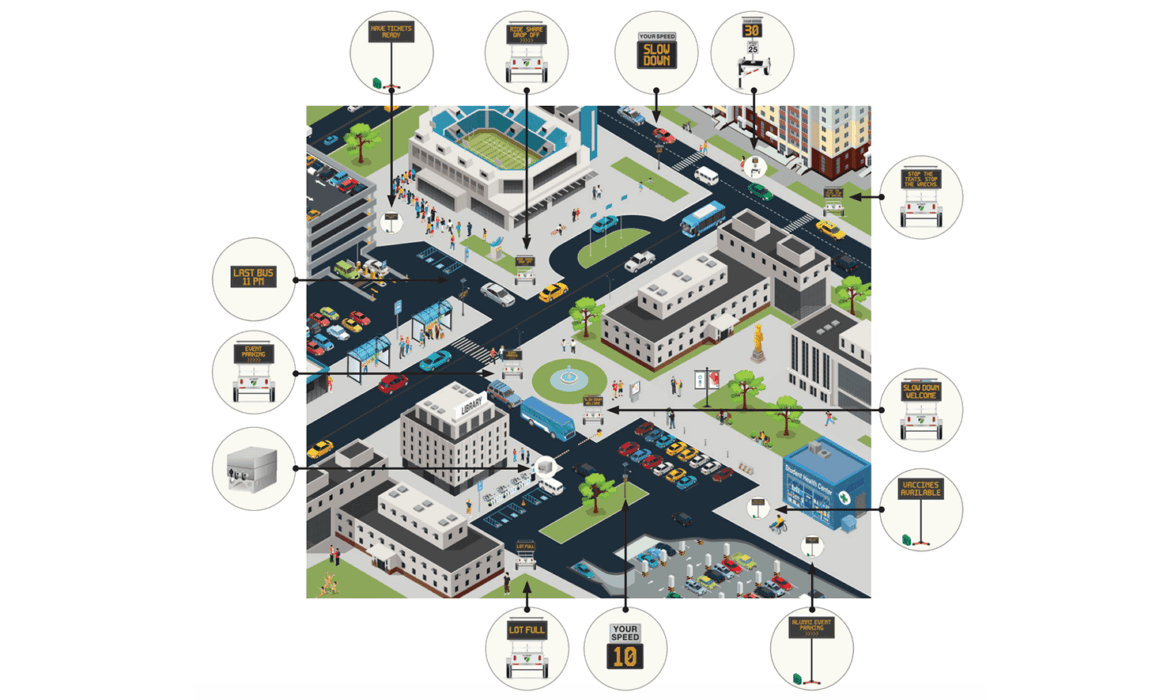
Enhance campus safety with radar speed and message signs. They are easy to deploy and can be remotely managed across your campus.
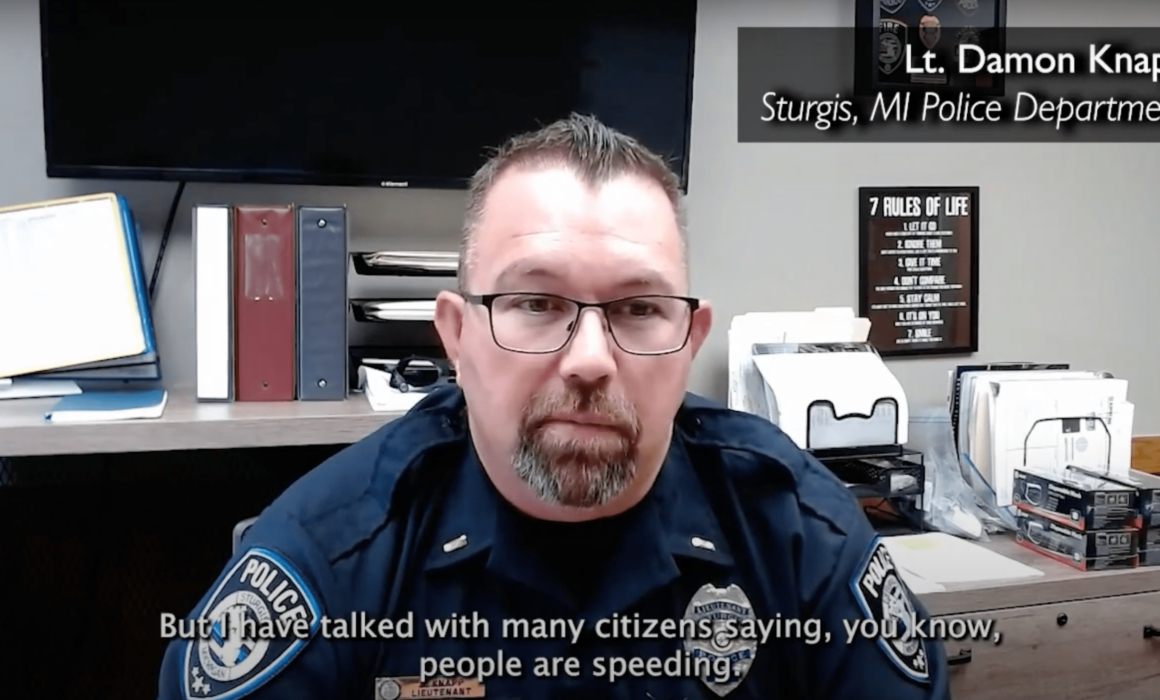
Learn how Sturgis Police Department reduced speeding in neighborhoods using speed reduction signs and data to resolve complaints and prioritize enforcement.
One thing I’m sure you’ve read about since the start of the COVID-19 pandemic: anarchy on the roads. There’s less traffic, and the consequence has been more speeding. That’s a life and death proposition with most of the country still facing social distancing restrictions and an increase in the number of pedestrians and bike riders on the streets. In Minnesota, 42 people were killed on the roadways in 45 days after the stay-at-home order was put in place on March 16. In Canada, a teen was caught speeding doing 191 mph and a Maryland man was caught going 187 MPH through a work zone in North Carolina. The problem is not just speeding, Ohio saw 154 traffic fatalities during the month of July, the highest since 2007. That’s sobering traffic data during a time when citations are down significantly in most areas. In Indianapolis, for instance, citations are down 93 percent.
Ultimately, while law enforcement has been focused on the crisis at hand, bad behaviors have developed. Some communities are fighting back: recently in Atlanta, police arrested 44 people, issued 114 citations, and impounded 29 vehicles in a proactive bid to cut down on street racing.
There’s another way communities can cut down on speeding: using data to prioritize enforcement. All Traffic Solutions collects volume and speed data on more than 100 million vehicles per month through our radar speed signs connected to our patented cloud software, TraffiCloud®. Leveraging traffic data from TraffiCloud, we conducted an extensive analysis of a handful of communities we serve and found that the overwhelming majority of drivers are still responding to speeding signs. In fact, in some cities, we have seen average speeds decrease along with the decrease in traffic volumes. Take, for example, a city we serve in Silicon Valley. The school district has a sign posted outside the high school that remains operational despite school having been canceled back in March. Speed postings change throughout the course of the day – and drivers are adjusting their speeds accordingly. Since the start of the pandemic, the average speed has been within 3 mph of the pre-COVID-19 limit.
From a compliance and risk perspective, another interesting finding was that the percentage of “violators”, which is defined as going 10+ miles per hour over the speed limit, has also stayed relatively flat during the pandemic. So, while our freeways are running amok with speeders, the data we have collected from TraffiCloud clearly reveals a different story where speed feedback is provided to the driver.
The solution to speeding is not something that can be decided unilaterally and rolled out. Each community must decide how to deal with speeding drivers; in many instances, communities are struggling with limited law enforcement resources who also have many other issues to deal with. Data is critical for managing – and ultimately enforcing – speeding on your highways and in your neighborhoods. More on that soon.
Traffic Device and Data Management software enables you to manage signs remotely. If, in the case of the school, the speed limit needs to be reduced at drop-off in the morning and pick-up in the afternoon, that can be done from the comfort of your home. Daily and weekly reports don’t need to be reviewed in a precinct. It can be done through a platform like TraffiCloud.
Speeding is not going away – but it can be measured and curbed. Put a plan in place now to use traffic data to your advantage by cutting the amount of time your law enforcement agencies need to spend on traffic worries.
By Andy Souders
CEO, All Traffic Solutions
As immersed as we are in traffic statistics each day at ATS, this particular statistic from a 2011 AAA Foundation for Traffic Safety study never ceases to hit home: “The average person hit by a car traveling 25 mph has a 12 percent chance of death. That drops to a 7 percent risk at 20 mph.”
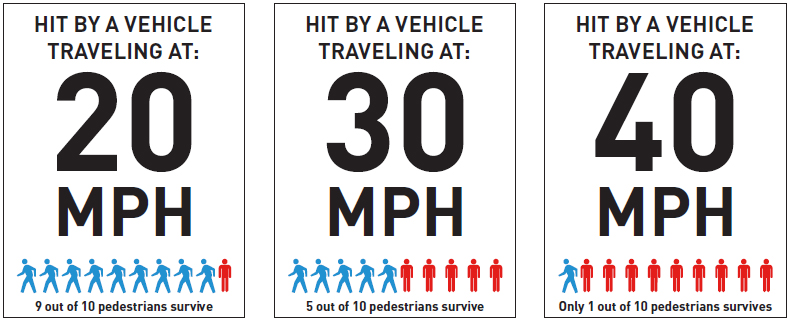
Pedestrian survival rates decrease as vehicle speed increases. The chance of a person dying as a result of being struck by a vehicle decreases 5 percent when the speed of the vehicle is just five mph lower. That’s one percentage point less for every reduced mile of speed. But if you double the vehicle speed from 20 mph to 40 mph, the chance of death doesn’t merely double from 7 percent to 14 percent—it skyrockets to 85 percent according to a National Transportation Safety Board 2017 study.
Pedestrian deaths from speeding increase exponentially as vehicle speed increases. Once cars reach a certain speed (just above 20 mph), they rapidly become more deadly. Think about the speed limits in your community, especially around schools, parks and shopping areas. If speed limits in those areas are set higher than 20 mph, it’s probably time to reassess and request a lower speed limit, as well as anywhere else where there is a disproportionate number of speeding vehicles.
Look at these stills from ProPublica’s interactive graph:


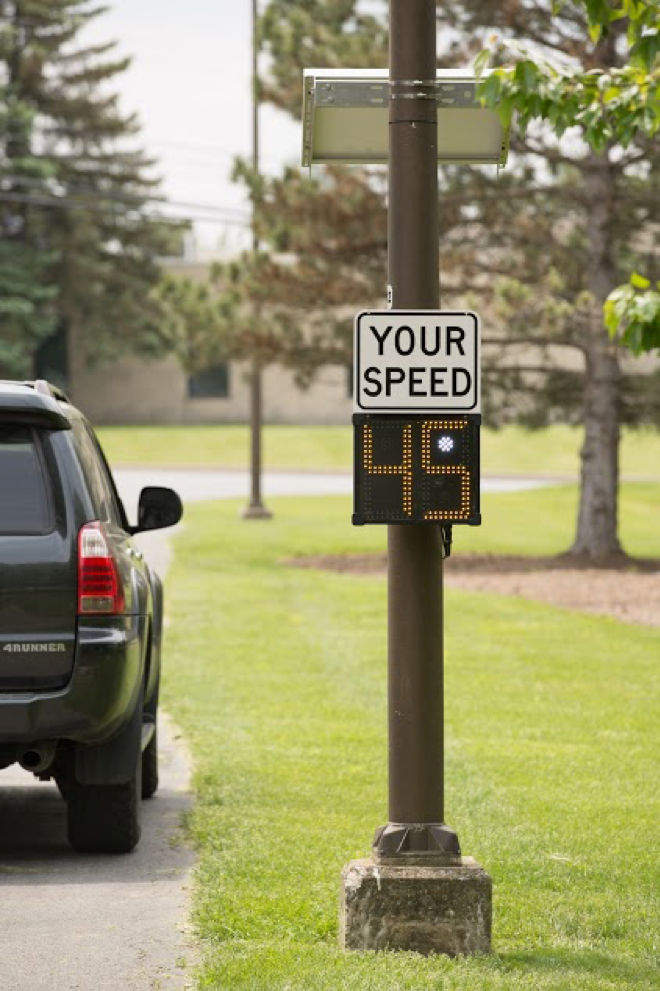
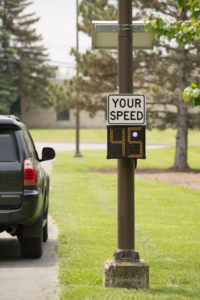
Radar signs are a versatile and effective traffic calming method and an efficient way to gather highly accurate speed data.
To demonstrate the volume and percentage of speeding vehicles on any given road, you’ll need to gather accurate speed data. You can run quick, easy speed studies using a radar speed display such as the Shield radar sign or SpeedAlert radar speed display from All Traffic Solutions.
![]() Both the web-enabled Shield and the SpeedAlert capture accurate speed and volume data, and when you the TraffiCloud traffic management system this data is automatically uploaded so you can run pre-designed reports and charts for traffic studies. Either device can also gather data in “stealth mode” so the sign appears to be turned off and drivers won’t slow down as they pass. This provides true data of drivers who aren’t on their “best behavior” because of the sign.
Both the web-enabled Shield and the SpeedAlert capture accurate speed and volume data, and when you the TraffiCloud traffic management system this data is automatically uploaded so you can run pre-designed reports and charts for traffic studies. Either device can also gather data in “stealth mode” so the sign appears to be turned off and drivers won’t slow down as they pass. This provides true data of drivers who aren’t on their “best behavior” because of the sign.
Radar speed displays are perfect for handling speed complaints—deploy one in lieu of a police officer and you save money and enable law enforcement to stay in the field. Then simply select your date and time range in TraffiCloud and produce a report to present to the citizen that shows the real story on speeding down their street.
If your goal is to increase traffic safety in your neighborhood, radar speed signs are effective traffic calming devices. All Traffic Solutions customers are seeing reductions in speed of as much as 23% and more after installing a radar speed display—making them one of the fastest, easiest and most effective traffic calming measures.
To test out ProPublica’s interactive speed chart click here.
As your community grows and your budget shrinks, your resources are probably being stretched to the limit. A growing population usually means an expanding infrastructure and more businesses moving to your area. How can you enforce speed limits and keep roads safe when you’re expected to do more and more with less?
All Traffic Solutions customers are finding success by making our portable web-enabled radar speed displays an important component of their traffic safety initiatives. This post will discuss three of the benefits of these versatile devices.
Most customers we speak with say that with the majority of speed-related complaints they receive related to a specific road prove to be largely unfounded. More often than not, it’s a perception problem. The resident may observe that cars are whizzing past their house in large numbers, but when an officer is deployed to the street to take Lidar readings, what they discover is that the percentage of speeding is quite low, or that there’s only an issue on Friday and Saturday nights between 10pm and midnight.
Having the officer park their car for the better part of a week to come to that conclusion isn’t proactive, it’s reactive and costly, and it’s taking them away from other important police work. When the next complaint call is received, they’re assigned to the next location to do the same thing all over again.
Another problem with sending an officer with Lidar is that when drivers spot the officer they’ll slow down so you’re not getting an accurate picture of the true extent of the speeding problem. Your officer can’t be at that site 24/7 so how do they know what time of day or days of the week is the issue most critical?
You can deploy a Shield 12 or Shield 15 radar speed sign in stealth mode at the location so that it captures data but doesn’t display speeds. Drivers don’t know that the sign is operational so they don’t alter their speed as they pass. The sign will capture up to 10 days of accurate speed and volume data and produce a documented report of that 10-day time period that they can slice and dice to understand what’s going on.You can download the report as a PDF to share with the complainant, share with management, bring to your next town council meeting or post on your website.
If you see that there is indeed a speeding problem, switch the sign to active mode so that it displays each driver’s speed as they pass. Oftentimes drivers don’t realize they’re surpassing the speed limit, and seeing their speed displayed is a jolting reminder to pay attention and slow down.
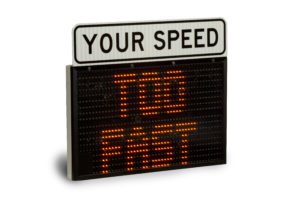
TIP: SpeedAlert 18 and SpeedAlert 24 radar speed displays can be programed to display both driver speed and speed-dependent messages for added reinforcement.
You can run a range of reports in literally seconds to understand traffic volume, high/low speeds, average speed, 85th percentile, etc. for a week, day, daypart or view a comparison. There’s a really helpful Enforcement Priorities report that combines all your locations and shows where and when there are issues at each location. Law enforcement can use this data to prioritize their resources so that problem locations are monitored at the right time.
Radar speed displays have been proven to reduce speeds and continue to calm traffic months after the sign has been installed. According to a study by the Texas Transportation Institute, there was an average reduction in vehicle speed of as much as nine miles per hour a full four months after a radar speed sign was installed. All Traffic Solutions customers report the same kinds of results, especially when the sign is installed, even temporarily, on a neighborhood road where residents travel often. When made aware that the police department is watching the area, driver behavior is lasting.
TIP: The best way to ensure lasting results and reinforce compliance is to mount your sign on a pole (it takes one person about five minutes) and use solar power so it’s always operational.
We hear success stories from customers in law enforcement, public works departments, college campuses and corporate facilities, and many call to purchase additional signs. They like the portability and the remote access. They see a reduced volume of complaints, they have traffic concrete data when they need it, and they can address issues effectively while tying up fewer resources.
SUGGESTED READING
PROVEN SOLUTIONS FOR INCREASING SCHOOL YEAR ROAD SAFETY
Download our free 10-page guide to get the facts about web-enabled radar speed displays, their benefits and how you can use data to support your case for the purchase of your new Shield or SpeedAlert.
5100 W. Brown Deer Road Brown Deer, WI 53223
866.366.6602