fbpx

Need radar speed signs or message signs ASAP? We can fulfill urgent requests.

GET A QUOTE
get a quote

Need radar speed signs or message signs ASAP? We can fulfill urgent requests.

GET IN TOUCH
Articles Tagged with

data and analytics

Home / data and analytics
"traffic-data-solution-speeding"/
Blog, law enforcement, smart cities, Traffic Data, traffic safety

Traffic Data: A Key Response To Today’s Speeding Crisis

One thing I’m sure you’ve read about since the start of the COVID-19 pandemic: anarchy on the roads. There’s less traffic, and the consequence has been more speeding. That’s a life and death proposition with most of the country still facing social distancing restrictions and an increase in the number of pedestrians and bike riders on the streets. In Minnesota, 42 people were killed on the roadways in 45 days after the stay-at-home order was put in place on March 16. In Canada, a teen was caught speeding doing 191 mph and a Maryland man was caught going 187 MPH through a work zone in North Carolina. The problem is not just speeding, Ohio saw 154 traffic fatalities during the month of July, the highest since 2007. That’s sobering traffic data during a time when citations are down significantly in most areas. In Indianapolis, for instance, citations are down 93 percent.

Ultimately, while law enforcement has been focused on the crisis at hand, bad behaviors have developed. Some communities are fighting back: recently in Atlanta, police arrested 44 people, issued 114 citations, and impounded 29 vehicles in a proactive bid to cut down on street racing.

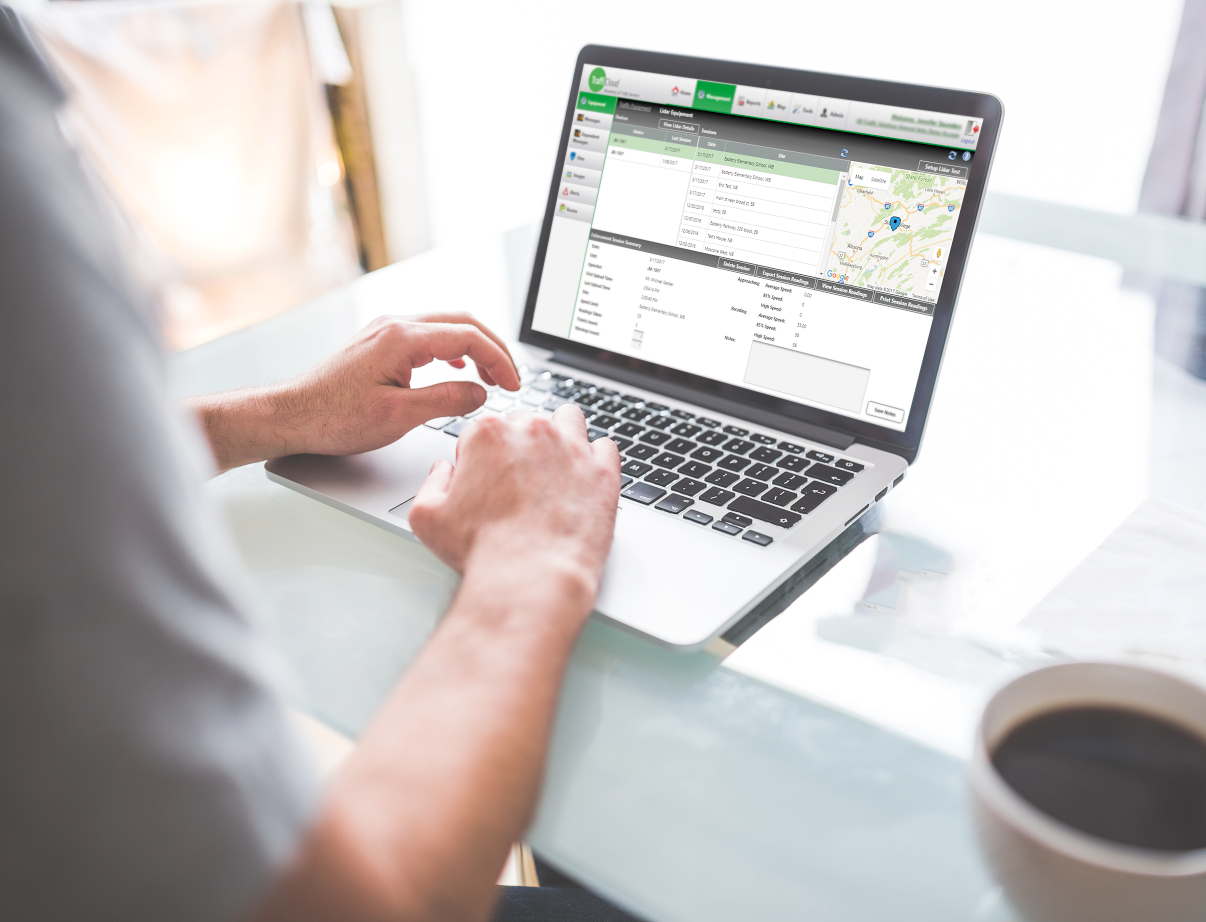
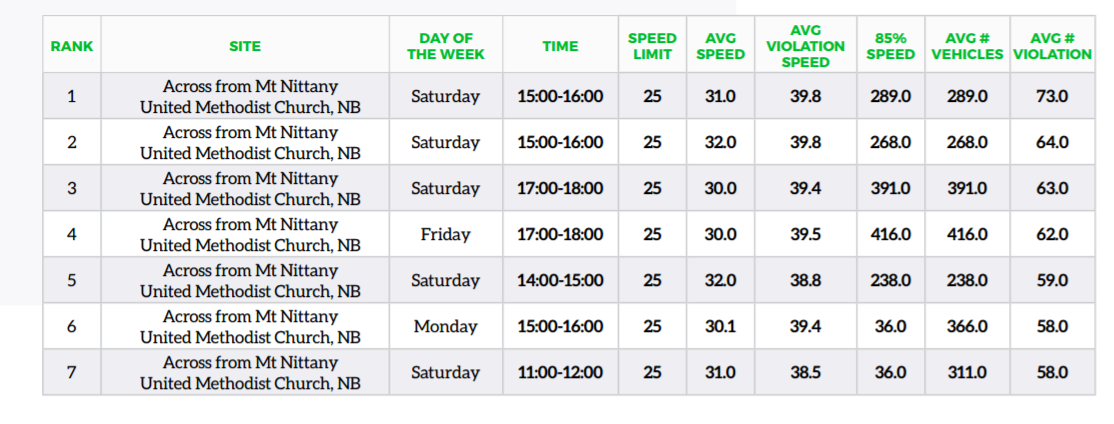
There’s another way communities can cut down on speeding: using data to prioritize enforcement.  All Traffic Solutions collects volume and speed data on more than 100 million vehicles per month through our radar speed signs connected to our patented cloud software, TraffiCloud®Leveraging traffic data from TraffiCloud, we conducted an extensive analysis of a handful of communities we serve and found that the overwhelming majority of drivers are still responding to speeding signs. In fact, in some cities, we have seen average speeds decrease along with the decrease in traffic volumes.  Take, for example, a city we serve in Silicon Valley. The school district has a sign posted outside the high school that remains operational despite school having been canceled back in March. Speed postings change throughout the course of the day – and drivers are adjusting their speeds accordingly. Since the start of the pandemic, the average speed has been within 3 mph of the pre-COVID-19 limit.

From a compliance and risk perspective, another interesting finding was that the percentage of “violators”, which is defined as going 10+ miles per hour over the speed limit, has also stayed relatively flat during the pandemic. So, while our freeways are running amok with speeders, the data we have collected from TraffiCloud clearly reveals a different story where speed feedback is provided to the driver.

The solution to speeding is not something that can be decided unilaterally and rolled out. Each community must decide how to deal with speeding drivers; in many instances, communities are struggling with limited law enforcement resources who also have many other issues to deal with. Data is critical for managing – and ultimately enforcing – speeding on your highways and in your neighborhoods. More on that soon.

Traffic Device and Data Management software enables you to manage signs remotely. If, in the case of the school, the speed limit needs to be reduced at drop-off in the morning and pick-up in the afternoon, that can be done from the comfort of your home. Daily and weekly reports don’t need to be reviewed in a precinct. It can be done through a platform like TraffiCloud.

Speeding is not going away – but it can be measured and curbed. Put a plan in place now to use traffic data to your advantage by cutting the amount of time your law enforcement agencies need to spend on traffic worries.

By Andy Souders
CEO, All Traffic Solutions

""/
Blog, Traffic Stop Blog

Three Powerful Ways to Use Traffic Data and Analytics

As your municipality becomes more populated and industry continues to grow, your roads have become more congested. In the past, increased traffic has meant assigning more personnel to carry out the important, never-ending task of managing traffic speed and safety. It’s difficult to assign more personnel when your budgets are shrinking and your resources are already overburdened. You need to approach the problem from a new perspective—one that leverages the technology at your fingertips with cutting-edge automation that makes it even more impact. Simply put, the answer better traffic management isn’t more manpower; it’s better traffic data and analytics.

Let’s take a look at three compelling reasons to use a data-centered approach to traffic management.

Reason #1 Obtain Grants and Funding

When you apply for a grant or other funding to support traffic calming and safety initiatives the competition can be significant. Your application is considered among hundreds of others, so how can you ensure that your grant application stands out from the pack?

The fact is that you are more likely to obtain funding if you demonstrate (1) that you have sufficient need and (2) the ability to accurately measure results. So, how do you demonstrate these two points? Data and analytics.

Fast, centralized access to comprehensive traffic data and analytics provides proof of need and accurately measures results by allowing your team to generate and distribute reports on demand for rapid response and simplified measurement.

Reports that are helpful in demonstrating your funding needs include:

  •  Site-specific speed summaries
  • 85th percentile volumes by day and time
  • Speed-limit-to-average-speed comparisons

Reports that measure success over time include:

  •  Traffic sign effectiveness reports, which chart the percentage of vehicles slowed by a specific radar speed display
  • Volume by compliance reports that display the number of vehicles that are speed-limit compliant, those inside the speed threshold, and those violating the speed limit by a predetermined percentage

By running the same report for two different time periods, you can compare the “before” and “after” data to track net changes and prove success.

Reason #2 Justify a Budget Request

Similar to when your department or agency submits a grant application, data analytics can be enormously helpful at budgeting time. When requesting funds for traffic calming and traffic safety initiatives, the extent to which you can show legitimate need now and results later can mean the difference between a thumbs up or thumbs down from the financial decision makers.

Another factor in your ability to secure budgeting approval is whether you can demonstrate how the community will save money by making staff and traffic engineers more efficient and effective. One way to accomplish this is by being able to accurately identify where officers should be deployed for maximum impact. For example, All Traffic Solutions TraffiCloud™ Enforcement Priorities Report lists recommended enforcement priorities ranked by site, time of day, and day of the week.

With quality data, like that generated in the TraffiCloud Speed Summary report, you can also determine when and where traffic studies are most needed.

This chart illustrates how TraffiCloud has the capacity to organize data so users can clearly determine when and where traffic control is needed

A TraffiCloud speed summary report provides visual to determine when/where traffic studies are needed.

Flexible, informative reports on all your traffic devices in one place and available from an Internet connection save staff considerable time because they no longer have to deal with manually collecting and entering data into spreadsheets. Less time spent on paperwork means greater accountability and more time analyzing data rather than recording it.

Reason #3 Clear Complaints

You know the importance of following up on neighborhood complaints regarding speeding. Addressing their concerns in a timely manner improves community relations and helps reduce paperwork for your staff.

At times, these complaints prove to be more of a perception problem. Other times there is cause for concern and remediation, but being able to prove or disprove speed issues often involves Lidar guns and manual data entry. How can you improve the process?

One solution is to first install a speed radar display on the road in question. Place the display on the road in “stealth mode” so that it can covertly gather speed data without appearing to be operational to passing drivers. If the data shows that most everyone is obeying the speed limit, you can clear the complaint without using considerable resources. If there is a problem, you know that you need to take action, such as requesting that a police officer with a Lidar device be assigned on the road for enforcement.

Using a web-enabled Lidar gun like DragonEye that records and transfers speed data to a central online location in real time, officers can collect and access more accurate data. This data can be analyzed using a reporting tool that’s built into your traffic management solution to measure success.

In our next post, we’ll share more reasons you need traffic data and analytics. If you would like to simplify and streamline the collection, management and distribution of traffic data in your municipality, we’re here to help.


Privacy Settings
We use cookies to enhance your experience while using our website. If you are using our Services via a browser you can restrict, block or remove cookies through your web browser settings. We also use content and scripts from third parties that may use tracking technologies. You can selectively provide your consent below to allow such third party embeds. For complete information about the cookies we use, data we collect and how we process them, please check our Privacy Policy
Youtube
Consent to display content from - Youtube
Vimeo
Consent to display content from - Vimeo
Google Maps
Consent to display content from - Google
Spotify
Consent to display content from - Spotify
Sound Cloud
Consent to display content from - Sound
get a quote