

Articles Tagged with
As your municipality becomes more populated and industry continues to grow, your roads have become more congested. In the past, increased traffic has meant assigning more personnel to carry out the important, never-ending task of managing traffic speed and safety. It’s difficult to assign more personnel when your budgets are shrinking and your resources are already overburdened. You need to approach the problem from a new perspective—one that leverages the technology at your fingertips with cutting-edge automation that makes it even more impact. Simply put, the answer better traffic management isn’t more manpower; it’s better traffic data and analytics.
Let’s take a look at three compelling reasons to use a data-centered approach to traffic management.
Reason #1 Obtain Grants and Funding
When you apply for a grant or other funding to support traffic calming and safety initiatives the competition can be significant. Your application is considered among hundreds of others, so how can you ensure that your grant application stands out from the pack?
The fact is that you are more likely to obtain funding if you demonstrate (1) that you have sufficient need and (2) the ability to accurately measure results. So, how do you demonstrate these two points? Data and analytics.
Fast, centralized access to comprehensive traffic data and analytics provides proof of need and accurately measures results by allowing your team to generate and distribute reports on demand for rapid response and simplified measurement.
Reports that are helpful in demonstrating your funding needs include:
- Site-specific speed summaries
- 85th percentile volumes by day and time
- Speed-limit-to-average-speed comparisons
Reports that measure success over time include:
- Traffic sign effectiveness reports, which chart the percentage of vehicles slowed by a specific radar speed display
- Volume by compliance reports that display the number of vehicles that are speed-limit compliant, those inside the speed threshold, and those violating the speed limit by a predetermined percentage
By running the same report for two different time periods, you can compare the “before” and “after” data to track net changes and prove success.
Reason #2 Justify a Budget Request
Similar to when your department or agency submits a grant application, data analytics can be enormously helpful at budgeting time. When requesting funds for traffic calming and traffic safety initiatives, the extent to which you can show legitimate need now and results later can mean the difference between a thumbs up or thumbs down from the financial decision makers.
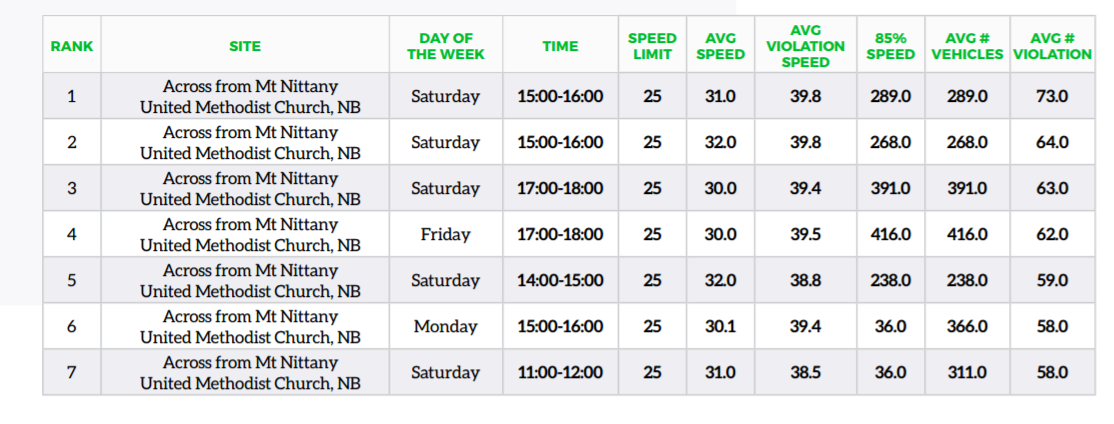
Another factor in your ability to secure budgeting approval is whether you can demonstrate how the community will save money by making staff and traffic engineers more efficient and effective. One way to accomplish this is by being able to accurately identify where officers should be deployed for maximum impact. For example, All Traffic Solutions TraffiCloud™ Enforcement Priorities Report lists recommended enforcement priorities ranked by site, time of day, and day of the week.
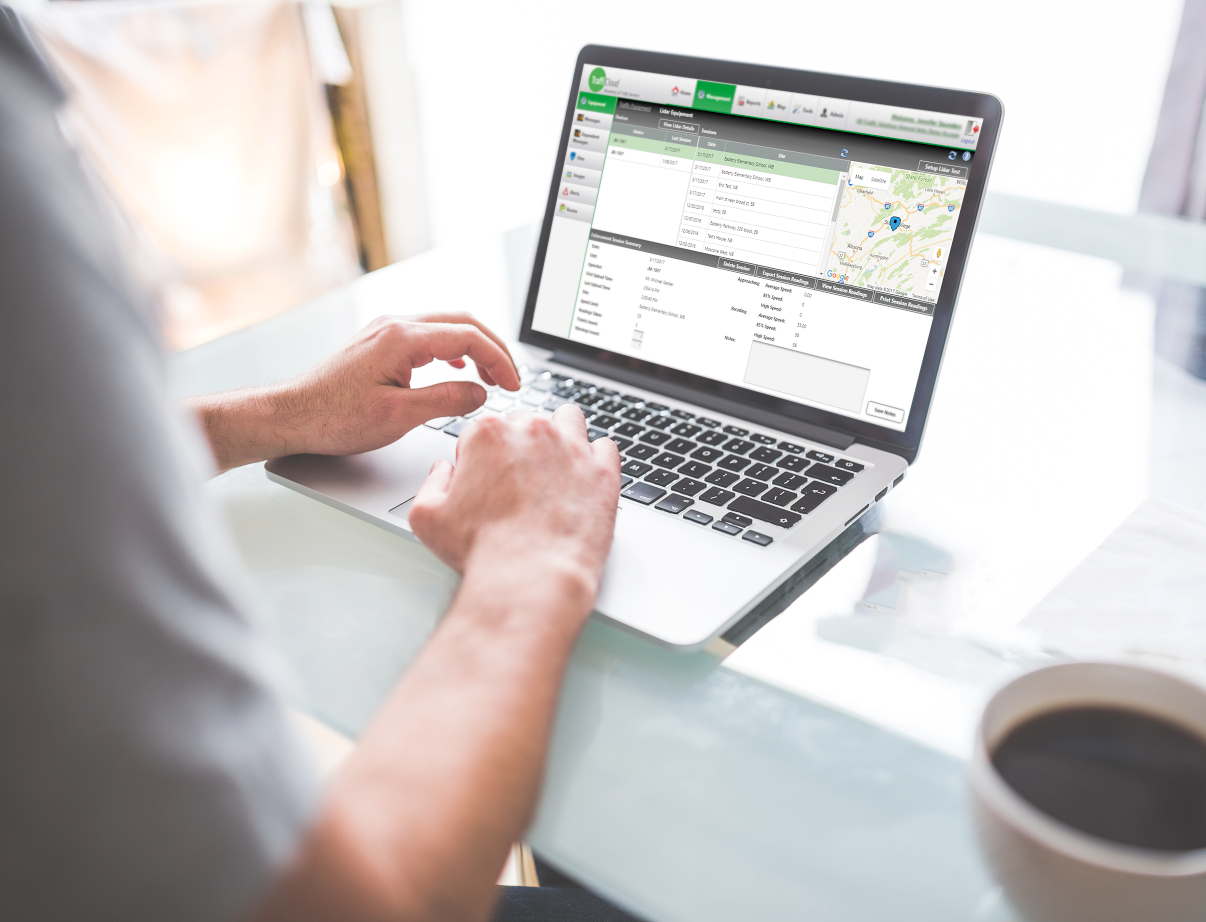
With quality data, like that generated in the TraffiCloud Speed Summary report, you can also determine when and where traffic studies are most needed.
A TraffiCloud speed summary report provides visual to determine when/where traffic studies are needed.
Flexible, informative reports on all your traffic devices in one place and available from an Internet connection save staff considerable time because they no longer have to deal with manually collecting and entering data into spreadsheets. Less time spent on paperwork means greater accountability and more time analyzing data rather than recording it.
Reason #3 Clear Complaints
You know the importance of following up on neighborhood complaints regarding speeding. Addressing their concerns in a timely manner improves community relations and helps reduce paperwork for your staff.
At times, these complaints prove to be more of a perception problem. Other times there is cause for concern and remediation, but being able to prove or disprove speed issues often involves Lidar guns and manual data entry. How can you improve the process?
One solution is to first install a speed radar display on the road in question. Place the display on the road in “stealth mode” so that it can covertly gather speed data without appearing to be operational to passing drivers. If the data shows that most everyone is obeying the speed limit, you can clear the complaint without using considerable resources. If there is a problem, you know that you need to take action, such as requesting that a police officer with a Lidar device be assigned on the road for enforcement.
Using a web-enabled Lidar gun like DragonEye that records and transfers speed data to a central online location in real time, officers can collect and access more accurate data. This data can be analyzed using a reporting tool that’s built into your traffic management solution to measure success.
In our next post, we’ll share more reasons you need traffic data and analytics. If you would like to simplify and streamline the collection, management and distribution of traffic data in your municipality, we’re here to help.
